Introduction
Note: this article has historically been co-written with my former colleague Gaby Fulchic, aka Weeking. It was posted on my previous employer’s corporate blog. This version is a more personal / less corporate version, which is also available in french.
If you’ve been living in a cave for the last 10 years and have never heard of Kubernetes, well… I invite you to check out my other articles on the subject (in french) xD.
In this article, I wanted to dig into a feature that’s been around for a while, but that I’ve rarely needed: HorizontalPodAutoscalers, particularly through the use of custom metrics.
Ready to scale? Let’s go!
What the heck is horizontal pod autoscaling (HPA)???
The HorizontalPodAutoscaler is a Kubernetes feature. It allows you to specify, for given metrics on a group of Pods, to try to reach target values. The most basic use of this feature is, you guessed it, to “scale” Pods based on basic metrics, for example CPU consumption.
Like everything in Kubernetes, it’s an API (currently autoscaling/v2). The simplest way to interact with it is to create a YAML manifest file where you describe the desired state of your application based on load.
By default, only simple metrics, CPU and memory consumption (those collected by metrics-server) are available to specify scaling rules.
A simple example could look like this:
apiVersion: autoscaling/v2
kind: HorizontalPodAutoscaler
metadata:
  name: myapp-hpa
  namespace: mynamespace
spec:
  maxReplicas: 6
  metrics:
    - resource:
        name: cpu
        target:
          averageUtilization: 50
          type: Utilization
      type: Resource
  minReplicas: 2
  scaleTargetRef:
    apiVersion: apps/v1
    kind: Deployment
    name: myapp
Note: HPA specifications can be incredibly more complex and powerful, as the API has been significantly enriched over the years. Don’t hesitate to read the official documentation ;-).
Based on the previous example, once the manifest is applied, Kubernetes will try to maintain an average CPU utilization around 50% across all “myapp” pods and will add replicas if the average CPU consumption exceeds this threshold. As soon as CPU consumption drops below the target, Kubernetes reduces the number of replicas, down to the minimum number if necessary.
Well, that’s the theory. But from experience, using HPA this way has limitations:
- Modern applications often have complex performance characteristics that are imperfectly described by CPU and RAM usage alone. For example, an application may be limited by input/output (I/O). Other factors like request latency, business metrics, or indicators on external dependencies (the number of messages in a queue, for example) can provide a better basis for scaling decisions.
- CPU usage can also be very high during the “boot” of a new pod, which can lead to more scaling than necessary (we talk about boot storms on more traditional infrastructures, I find the term appropriate).
The HorizontalPodAutoscaler reacts to metrics retrieved at a given moment, which means there can be a lag between the metric peak and the scaling response. This can lead to temporary performance degradation. Finding metrics that allow anticipating the need for scaling rather than reacting after degradation is therefore the objective to keep in mind to improve the reliability of our apps.
To address these limitations, Kubernetes allows the use of custom metrics offering greater flexibility and better control over application scaling behavior. This is where tools like Prometheus and Prometheus Adapter come in, which will allow us more adapted / effective autoscaling strategies.
Prometheus and metrics via /-/metrics
Like Kubernetes, Prometheus is another major project under the CNCF umbrella. It’s a metrics collection tool, which has a time series database (TSDB) optimized for storing infrastructure metrics and a query language allowing deep but easy and powerful analyses of these metrics. Again, I’ve already written several articles on the subject (in french).
Generally, we classify monitoring tools into two broad categories. Those that receive metrics from clients that “push” them and those that periodically “pull” metrics from the applications themselves. Prometheus uses the “pull” strategy (most of the time) and, by default, it will collect our metrics every 30 seconds.
This means you don’t need to install an “agent” on your applications BUT you must specify to Prometheus a list of “targets” that expose HTTP endpoints (your applications) serving metrics in a specific format, usually on the path /-/metrics:
$ kubectl -n mynamespace port-forward myapp-5584c5c8f8-gbsw8 3000
Forwarding from 127.0.0.1:3000 -> 3000
Forwarding from [::1]:3000 -> 3000

# in another terminal
$ curl localhost:3000/-/metrics/ 2> /dev/null | head
# HELP http_request_duration_seconds duration histogram of http responses labeled with: status_code method path
# TYPE http_request_duration_seconds histogram
http_request_duration_seconds_bucket{le="0.0002"status_code="200"method="GET"path="/-/health"} 0
http_request_duration_seconds_bucket{le="0.0005"status_code="200"method="GET"path="/-/health"} 364
[...]
We can then query Prometheus to get these metrics by specifying the metric name and adding labels to specify which subset we’re interested in:
http_request_duration_seconds_bucket{kubernetes_namespace='mynamespace' kubernetes_pod_name="myapp-5584c5c8f8-gbsw8"}
I’ll assume you have a Prometheus available on your cluster for the rest of the article (otherwise, check out the Prometheus Operator).
Thanks to Prometheus, we now have a multitude of metrics to choose from to predict whether our applications should be scaled proactively. However, the problem is that we can’t tell the HPA to directly monitor these metrics, because the HPA isn’t directly compatible with the Prometheus query language PromQL.
Prometheus Adapter to the rescue
So we need another tool that will retrieve metrics from Prometheus and provide them to Kubernetes. You’ve guessed which software it is now: Prometheus Adapter.
We’ll install it from a Helm chart hosted on the prometheus-community repository:
$ helm show values prometheus-community/prometheus-adapter > values.yaml

$ helm install -n monitoring prometheus-adapter prometheus-community/prometheus-adapter -f values.yaml

$ kubectl -n monitoring get deployments.apps
NAME                             READY   UP-TO-DATE   AVAILABLE   AGE
metrics-server                   2/2     2            2           1d
prom-operator-kube-state-metrics 1/1     1            1           1d
prom-operator-operator           1/1     1            1           1d
prometheus-adapter               1/1     1            1           1d
prom-operator-query              3/3     3            3           1d
In this example, you can see that I’ve already deployed metrics-server and Prometheus using Prometheus Operator, and that Prometheus Adapter is running.
By default, Prometheus Adapter will be deployed with certain custom metrics that we can use “out of the box” to scale our applications more precisely. But in this article, we’re going to show you how to create ✨ your own ✨ metrics.
Configuring Prometheus Adapter to expose custom metrics via the API Server
Initially, the Prometheus Adapter configuration contains no rules. This means no custom metrics are exposed via the API Server at the start, and HPA can’t use custom metrics.
Prometheus Adapter works in this order:
- Discover metrics by contacting Prometheus
- Associate them with Kubernetes resources (namespace, pod, etc.)
- Check how to expose them (if necessary, it can rename metrics)
- Check how to query Prometheus to get actual values (e.g., compute a “rate”).
First, we need to validate the custom metrics API on our cluster. The resources list will be empty, but this proves that the custom.metrics.k8s.io/v1beta1 API is accessible.
└─[$] kubectl get --raw "/apis/custom.metrics.k8s.io/v1beta1" | jq
{
  "kind": "APIResourceList",
  "apiVersion": "v1",
  "groupVersion": "custom.metrics.k8s.io/v1beta1",
  "resources": []
}
Several steps are then needed for Prometheus Adapter to collect and provide metrics to the Kubernetes API server. All Prometheus Adapter configuration can be adjusted via the Helm chart’s values.yaml file.
The first thing to configure here is “where” Prometheus Adapter can contact Prometheus. If Prometheus Adapter is running on the same cluster as the Prometheus stack, you can use an internal (to Kubernetes) DNS record as below (see Kubernetes DNS documentation for services and pods). Otherwise, you can specify an IP address (or DNS name) and port number.
values.yaml > prometheus:
  url: http://prom-operator-query.monitoring.svc
  port: 9090
  path: ""
To verify that Prometheus Adapter can properly contact Prometheus, you just need to check the pod logs (using kubectl logs pod/prometheus-adapter-abcdefgh-ijklm or any other means at your disposal to read pod logs).
Once this part is operational, we need to add some rules to our Prometheus Adapter.
In this example, I chose to use a metric called ELU (for “Event Loop Utilization”) collected from a Node.js server. It measures how much time the Node.js event loop is busy processing events versus being idle, and it’s more representative of server load than simple CPU percentage.
Rules allow us to specify what to query in Prometheus. We can define which labels to import and, if necessary, replace them to match Kubernetes resource names. Here are the most useful values to specify:
- seriesQuery: executes the PromQL query, possibly filtered
- resources: maps time series labels to Kubernetes resources
- name: exposes time series with different names from the originals
- metricsQuery: method to ask Prometheus to get a rate («.GroupBy» means “group by Pod” by default)
values.yaml > rules:
  default: false
  custom:
    - seriesQuery: 'elu_utilization{kubernetes_namespace!=""kubernetes_pod_name!=""}'
      resources:
        overrides:
          kubernetes_namespace: {resource: "namespace"}
          kubernetes_pod_name: {resource: "pod"}
      name:
        matches: ^elu_utilization$
        as: ""
      metricsQuery: sum(<<.Series>>{<<.LabelMatchers>>}) by (<<.GroupBy>>)
You should now be able to get some custom metrics with actual values by accessing the API server. To test, we’ll use kubectl and the --raw parameter, which gives us more control over requests sent to the API server.
Here are some example commands you can run to manually verify that metrics are correctly exposed via the API Server:
# list custom metrics discovery
kubectl get --raw "/apis/custom.metrics.k8s.io/v1beta1" | jq

# list custom metric values for each pod
kubectl get --raw "/apis/custom.metrics.k8s.io/v1beta1/namespaces/<namespace_name>/pods/*/elu_utilization" | jq
Warning: scaling will be heavily dependent on your metrics scraping interval and your Prometheus Adapter discovery interval. The official documentation insists that you might encounter problems if you set a value too low.
“You’ll need to also make sure your metrics relist interval is at least your Prometheus scrape interval. If it’s less than that, you’ll see metrics periodically appear and disappear from the adapter.”
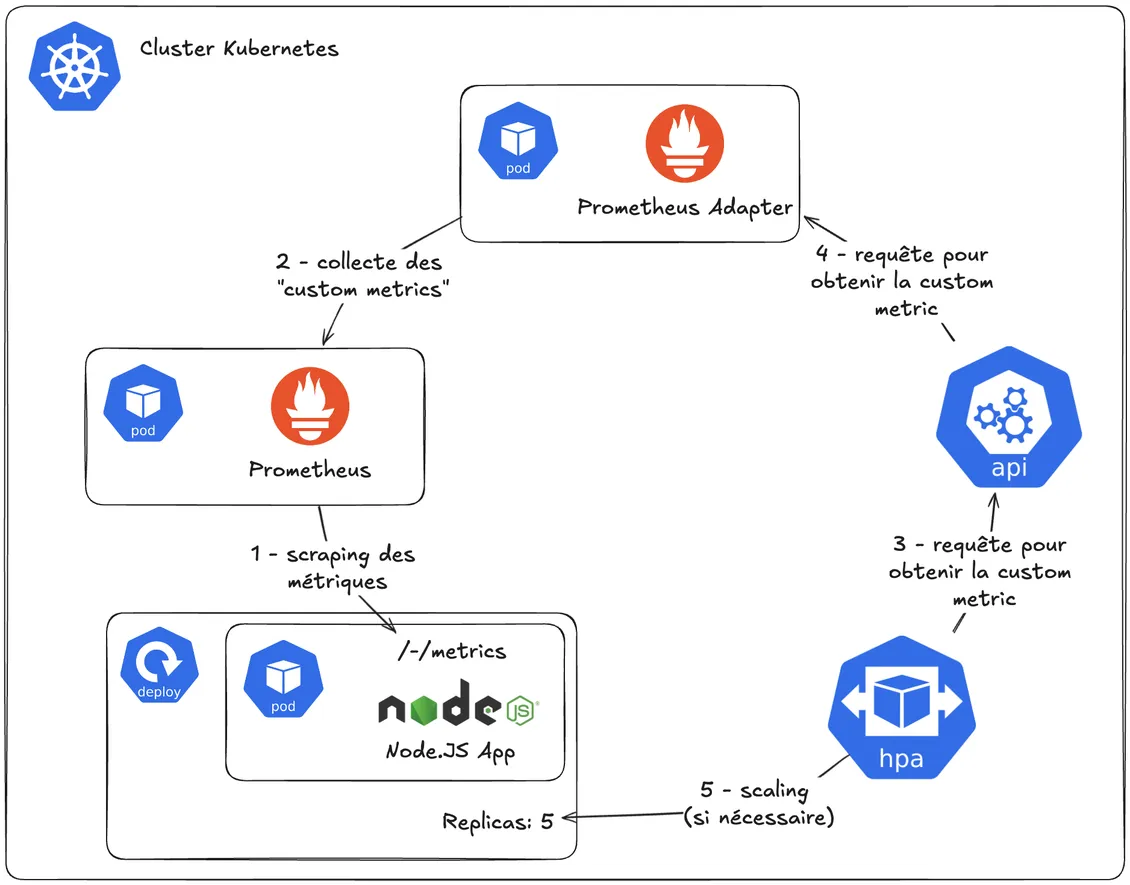
How will this work?
So far, we’ve introduced several components that interact with each other.
But how will all this work under the hood? Well, nothing better than a diagram to explain things like this:

- Prometheus scrapes metrics exposed by our application
- Prometheus Adapter queries the Prometheus server to collect the specific metrics we defined in its configuration
- The HorizontalAutoscaler (the controller that manages HPAs) will query the API server to periodically check if the ELU metric is within acceptable limits…
- … which in turn will ask Prometheus Adapter.
Let’s now create our first HorizontalPodAutoscaler!
Using a HorizontalPodAutoscaler resource with custom metrics
At the beginning of this post, we introduced the HorizontalPodAutoscaler API. The resource itself isn’t hard to use. Basically, HPA takes a target deployment to scale, a minimum number of replicas, a maximum number of replicas, and the metrics to use. For the metrics part, we’ll now use our article’s custom metric configured with Prometheus Adapter:
apiVersion: autoscaling/v2
kind: HorizontalPodAutoscaler
metadata:
spec:
  maxReplicas: 6
  metrics:
  - pods:
      metric:
        name: elu_utilization
      target:
        averageValue: 500m
        type: Utilization
    type: Pods
  minReplicas: 2
  scaleTargetRef:
    apiVersion: apps/v1
    kind: Deployment
    name: <deployment.apps_name>
When you configure an HPA resource, you only define the metric name. But how can HPA determine the right metric from the right pods since several applications can expose this same metric? To understand this, we can examine Prometheus Adapter logs.
I0618 12:05:29.149095 1 httplog.go:132] "HTTP" verb="GET" URI="/apis/custom.metrics.k8s.io/v1beta1/n
As you can see, a labelSelector is added to the request. And since you mention the Deployment in the HPA’s scaleTargetRef reference, the latter uses the labelSelector value from the Deployment’s label selector. This allows you to target metrics from a specific Deployment. And these labels exist because, when scraping pods with Prometheus, Kubernetes pod discovery component adds them to the metrics.
If you want to use a custom labelSelector in the query, add the metrics.pods.metric.selector field to the HPA resource.
So we have the custom metrics API, we’ve configured Prometheus Adapter to discover and expose certain metrics, and we’ve created our first HPA resource. It’s now time to test the deployment under load and observe the behavior.
For this, we’ll present you with a tool named Vegeta (it’s over 9000!)
Vegeta is a versatile HTTP load testing tool built out of a need to drill HTTP services with a constant request rate.
We’ll use Vegeta to generate load on our application while monitoring the application’s pods and HPA status (with 3 terminals open in parallel):
kubectl get hpa/<myhpa> -w -n <mynamespace>
kubectl get po -l app=<myapp> -w -n <mynamespace>
vegeta attack <app_endpoint_http>
Note: In case your application can support a significant load and default parameters don’t trigger scaling, you can modify some parameters in the Vegeta command. We recommend using the workers and rate options:
- –workers: initial number of workers (default 10)
- –rate: number of requests per time unit [0 = infinite] (default 50/1s)
When load increases, your custom metric value will also increase, which should in turn trigger deployment scaling once thresholds are reached.
Using Prometheus Adapter in production
When Prometheus Adapter becomes a central component of your architecture, its tuning and monitoring become essential.
If this component is down, your HPA won’t be able to react anymore. There will be two potential impacts: you’ll use too many resources for current traffic, or conversely, not have enough to handle traffic. In any case, your workloads aren’t immediately affected; they maintain the last number of replicas calculated by HPA before the outage.
To prevent this from becoming a SPOF, make sure to put more than one replica for Prometheus Adapter. And I also advise adding a PodDisruptionBudget to avoid issues during your cluster maintenance.
Conclusion
Kubernetes’ built-in horizontal pod autoscaling is a standard mechanism that can potentially help your apps efficiently handle variable loads. Personally, I find the classic HPA, which uses CPU and memory metrics, too limited. But with the integration of custom metrics with Prometheus Adapter, we can make scaling decisions more precise and relevant.
While installing Prometheus Adapter is simple, its configuration is, I find, a bit counter-intuitive, even complex, without effectively handling the most advanced scenarios.
That’s why I think that, if you don’t have a requirement to stick with the Kubernetes standard, you should take a look (or wait for my next article?) at KEDA (Kubernetes Event-Driven Autoscaling), another open-source project that extends HPA capabilities by supporting various event sources and scaling triggers.
Happy scaling!
Additional sources
Prometheus Adapter documentation:
Kubernetes HPA documentation:
Other: