What is zeropod?
A little less than a year ago, I published a first article, reviewing a tool called zeropod.
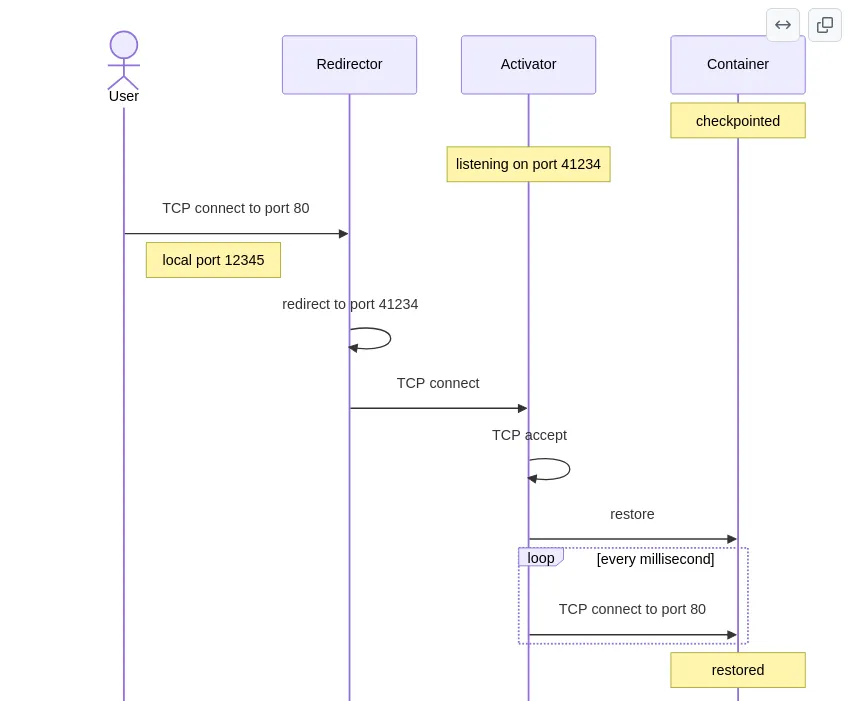
Zeropod is a Kubernetes runtime (more specifically a containerd shim) that automatically checkpoints containers to disk after a certain amount of time of the last TCP connection.
While in scaled down state, it will listen on the same port the application inside the container was listening on and will restore the container on the first incoming connection.
At the time, the stable version was v0.6.x, and I tested it on a k3s cluster. The results were mixed: it mostly worked, but with deal-breaking limitations for serious use (probes impossible, flaky behavior under load, checkpointing times a bit high for my taste).
Since then, the project has evolved quite a bit (now v0.12.0), with promises of fixes and improvements. So I decided to give it another shot to see where things stand.
One other change: I abandoned k3s for this test series, for reasons I’ll detail throughout the article.
Prerequisites
This time, I used a freshly provisioned server at my favorite hosting provider:
- An Ubuntu 24.04.3 LTS (Noble) server, kernel 6.17.0-35 HWE, 7.7 Gi RAM, 100G disk
- A Kubernetes cluster set up with kubeadm, flannel as CNI
- Vanilla containerd
- local-path-provisioner (Rancher) for default local storage
- No cert-manager or Ingress, keeping it simple this time
Installation
I’ve installed kubeadm many times and you probably have too, so I won’t insult you with yet another tutorial.
# Install kubeadm, kubelet, kubectl + containerd
sudo kubeadm init --pod-network-cidr=10.42.0.0/16
kubectl apply -f https://github.com/flannel-io/flannel/releases/latest/download/kube-flannel.yml
kubectl taint nodes --all node-role.kubernetes.io/control-plane-
Once the cluster is running, installing zeropod is trivial:
# Apply the generic kustomize
kubectl apply -k https://github.com/ctrox/zeropod/config/generic

# Add a label to our single node
kubectl label node <your-node> zeropod.ctrox.dev/node=true

# Verify the pod is running
kubectl -n zeropod-system wait --for=condition=Ready pod -l app.kubernetes.io/name=zeropod-node
That’s it. No special flags, no extra configuration. On kubeadm, kubelet is a native binary (/usr/bin/kubelet) detected automatically by zeropod.
Note about k3s: on k3s, the zeropod documentation differs since the config to use is config/k3s. The kustomize adds a -probe-binary-name=k3s flag on the initContainer so the shim knows the kubelet is embedded in the k3s binary. During my tests, even with this flag, the behavior wasn’t as expected (the socket tracker didn’t filter probes correctly). With the default config, the flag is on the initContainer but not on the manager. I suspected there was another component to patch, but I didn’t investigate further.
The DaemonSet deploys the following images:
ghcr.io/ctrox/zeropod-manager:v0.12.0ghcr.io/ctrox/zeropod-installer:v0.12.0ghcr.io/ctrox/zeropod-criu:v4.2(CRIU has been updated since v0.6.x)
Let’s verify the zeropod runtimeClass is available:
kubectl get runtimeclass
NAME                  HANDLER               AGE
zeropod               zeropod               30m
First test: nginx
Like last time, let’s start with a simple nginx test. Deploy a basic pod:
apiVersion: apps/v1
kind: Deployment
metadata:
  name: nginx
spec:
  replicas: 1
  selector:
    matchLabels:
      app: nginx
  template:
    metadata:
      annotations:
        zeropod.ctrox.dev/scaledown-duration: 10s
      labels:
        app: nginx
    spec:
      runtimeClassName: zeropod
      containers:
      - image: nginx
        name: nginx
        ports:
        - containerPort: 80
The important parts are the annotation zeropod.ctrox.dev/scaledown-duration: 10s and runtimeClassName: zeropod.
Shortly after deployment, zeropod detects the absence of traffic. The container is checkpointed. Looking at the manager logs:
{"time":"2026-05-29T14:26:37.269453861Z","level":"INFO","msg":"status event","container":"nginx","pod":"nginx-bench-7c65c8874-6pts7","phase":"RUNNING","duration":"0s"}
Then 10 seconds later:
{"time":"2026-05-29T14:26:47.465510937Z","level":"INFO","msg":"status event","container":"nginx","pod":"nginx-bench-7c65c8874-6pts7","phase":"SCALED_DOWN","duration":"191.259383ms"}
The duration field in the SCALED_DOWN log is the checkpoint time: 191ms. That’s already significantly better than the ~400ms from v0.6.x on k3s (likely thanks to an update, perhaps CRIU 4.2?).
Restore
When we send an HTTP request, the container wakes up:
time curl http://<POD_IP>/ -s -o /dev/null -w "%{http_code} (%{time_total}s)"
HTTP 200 (0.101s)

real    0m0.101s
user    0m0.003s
sys     0m0.003s
101ms to restore nginx and serve a page. That’s comparable to the ~92ms from the original article.
Nice new feature: under v0.6.x, kubectl top pods returned an error for checkpointed pods:
# v0.6.x
kubectl top pods
error: Metrics not available for pod default/php-xxx
This bug was fixed in v0.9.0. Now pods in SCALED_DOWN state return 0m 0Mi:
kubectl top pods
NAME      CPU(cores)   MEMORY(bytes)
nginx     0m           0Mi
Much cleaner.
Testing liveness probes
This was THE major limitation of v0.6.x: zeropod was incompatible with Kubernetes probes. If you added an httpGet liveness probe to your container, the probe would reset the scale-down timer, and your container would never go SCALED_DOWN. Result: probes unusable, making zeropod unusable in production.
What changed
Two fixes were made between v0.6.x and v0.12.0:
The activator (the eBPF component that listens for traffic during SCALED_DOWN): it intercepts probes and replies 200 directly, without waking the container. That’s the “post scale-down” behavior.
The socket tracker (the component that ignores connections during RUNNING state): since PR #72 (merged August 2025), zeropod can detect connections coming from kubelet and not count them as “real” traffic. That’s the “pre scale-down” behavior.
Real-world test
I deployed nginx with an aggressive liveness probe (periodSeconds: 5) and scaledown-duration: 10s:
spec:
  runtimeClassName: zeropod
  containers:
  - image: nginx
    name: nginx
    livenessProbe:
      httpGet:
        path: /
        port: 80
      periodSeconds: 5
On k3s, this test gave me trouble: the socket tracker couldn’t filter probe connections, which kept resetting the scale-down timer indefinitely. The activator (which filters probes once scale-down has happened) worked fine though.
On kubeadm, the result is immediate:
kubectl get pod -l app=nginx-probe -o json | jq -r '.items[0].metadata.labels["status.zeropod.ctrox.dev/nginx"]'
SCALED_DOWN
The socket tracker correctly filters connections from the native kubelet. The periodSeconds > scaledown-duration rule I had to use on k3s is no longer necessary.
A word on changes between v0.6.x and v0.12.0
Here’s a summary of improvements between the two versions:
| Point | v0.6.x | v0.12.0 |
|---|---|---|
kubectl top pods while scaled-down | ❌ Error | ✅ 0m 0Mi (fix v0.9.0) |
| Checkpoint (nginx) | ~400ms | ~185ms (-54%) |
| Restore (nginx) | ~92ms | ~99ms (stable) |
| CRIU | v3.x | v4.2 |
| Checkpoint failure handling | basic | metrics + events (v0.11.0) |
| Configurable proxy timeouts | ❌ | ✅ (v0.11.0) |
| Inter-node migration | basic | improved + timeouts (v0.10.0) |
| Probes | ❌ Incompatible | ✅ Activator + socket tracker |
Interesting technical note about CRIU flags: zeropod removed the --tcp-established option in September 2025. Previously, active TCP connections were saved and restored with the container. Now, zeropod uses --tcp-skip-in-flight (when runc >= 1.3 supports it). Practical consequence: if your container has outgoing TCP connections at checkpoint time, they will be lost. You’ll need to re-establish them after restore.
Deploying WordPress (the “““realistic””” use case)
Alright, nginx is fine but not very representative. Let’s deploy a real app with PHP, Apache, and a database.
Let’s reuse the WordPress manifest from the original article, without zeropod on MySQL:
apiVersion: apps/v1
kind: Deployment
metadata:
  name: wordpress
spec:
  replicas: 1
  selector:
    matchLabels:
      app: wordpress
  template:
    metadata:
      annotations:
        zeropod.ctrox.dev/scaledown-duration: 10s
        zeropod.ctrox.dev/container-names: wordpress
        zeropod.ctrox.dev/ports-map: wordpress=80
      labels:
        app: wordpress
    spec:
      runtimeClassName: zeropod
      initContainers:
      - name: wait-for-mysql
        image: mysql:8
        command:
        - sh
        - -c
        - |
          until mysql -h mysql -u root -p${MYSQL_ROOT_PASSWORD} -e "SELECT 1"; do
            echo "Waiting for MySQL..."
            sleep 3
          done
          mysql -h mysql -u root -p${MYSQL_ROOT_PASSWORD} -e "CREATE DATABASE IF NOT EXISTS wordpress;"
        env:
        - name: MYSQL_ROOT_PASSWORD
          value: verySecurePassword
      containers:
      - image: wordpress:latest
        name: wordpress
        ports:
        - containerPort: 80
        env:
        - name: WORDPRESS_DB_HOST
          value: mysql
        - name: WORDPRESS_DB_USER
          value: root
        - name: WORDPRESS_DB_PASSWORD
          value: verySecurePassword
        - name: WORDPRESS_DB_NAME
          value: wordpress
MySQL (without zeropod):
apiVersion: v1
kind: Service
metadata:
  name: mysql
spec:
  ports:
  - port: 3306
  selector:
    app: mysql
  clusterIP: None
---
apiVersion: apps/v1
kind: StatefulSet
metadata:
  name: mysql
spec:
  serviceName: mysql
  replicas: 1
  selector:
    matchLabels:
      app: mysql
  template:
    metadata:
      labels:
        app: mysql
    spec:
      containers:
      - image: mysql:8
        name: mysql
        ports:
        - containerPort: 3306
        env:
        - name: MYSQL_ROOT_PASSWORD
          value: verySecurePassword
        volumeMounts:
        - mountPath: /var/lib/mysql
          name: data
  volumeClaimTemplates:
  - metadata:
      name: data
    spec:
      accessModes:
      - ReadWriteOnce
      resources:
        requests:
          storage: 5Gi
WordPress (Apache + PHP) checkpoint:
{"time":"2026-05-29T14:33:35.915988635Z","phase":"SCALED_DOWN","duration":"313.286787ms"}
Checkpoints take around 300ms. Restore is around 200ms:
{"time":"2026-05-29T14:34:31.56806589Z","phase":"RUNNING","duration":"206.33005ms"}
The first curl request confirms it:
time curl http://<POD_IP>/ -s -o /dev/null -w "%{http_code} (%{time_total}s)"
HTTP 302 (0.212s)
212ms, about twice faster than the 454ms from the original article.
The killer test: cascading WordPress + MySQL
In the original article, I attempted the ultimate test: putting both pods (WordPress AND MySQL) with runtimeClassName: zeropod, then sending an HTTP request to WordPress while both are checkpointed.
The scenario goes like this:
- After a few seconds, WordPress goes SCALED_DOWN, MySQL goes SCALED_DOWN too
- A client sends an HTTP request to WordPress
- The WordPress activator intercepts the request and restores the WordPress container
- WordPress (Apache+PHP) starts up, executes PHP code requiring a MySQL connection
- WordPress connects to MySQL on port 3306
- The MySQL activator intercepts the connection and restores MySQL
- MySQL responds, WordPress generates the page, Apache sends back the HTTP response
True scale to zero that scales the entire app, not just the frontend/backend.
Important note: I know that you’d probably never want to scale down your database in production, but testing this shows that this approach (eBPF + CRIU) works beyond just scaling webservers to zero, which other tools on the market already do very well.
On k3s: no luck, on kubeadm: victory
On k3s, I still haven’t managed to make this scenario work: WordPress would restore but wouldn’t respond on port 80. I spent quite some time trying to figure out why, without success.
Same test, same zeropod version, but on kubeadm:
curl http://<POD_IP>/ -s -o /dev/null -w "%{http_code} (%{time_total}s)"
HTTP 302 (0.224s)
224ms. Both pods went from SCALED_DOWN to RUNNING, the WordPress page loads. I repeated the test 5 times in a row:
| Cycle | Time (curl) | HTTP |
|---|---|---|
| 1 | 229ms | 302 |
| 2 | 192ms | 302 |
| 3 | 227ms | 302 |
| 4 | 230ms | 302 |
| 5 | 211ms | 302 |
The zeropod logs confirm both containers waking up:
WordPress: SCALED_DOWN → RUNNING
MySQL:     SCALED_DOWN → RUNNING
What really changed since v0.6.x
Probes (finally!)
This was my main grievance in the first article. Today, it’s resolved:
- Before: impossible to use Kubernetes probes → zeropod unusable in any somewhat serious use case
- After: the activator intercepts probes in SCALED_DOWN (replies 200 without restore), and the socket tracker filters kubelet connections in RUNNING state
Stability
The flaky behavior (pod loss under simultaneous load) is gone. Where I had failures in the original article, sequential and simultaneous load tests all pass now.
Performance
Checkpoint gained ~50% speed (185ms vs 400ms). Restore too (200ms vs 454ms). Probably thanks to CRIU v4.2 and zeropod optimizations.
kubectl top pods
This small detail was an eyesore — kubectl top pods crashed on checkpointed pods. Fixed in v0.9.0.
Some remaining limitations
I’d be dishonest if I said everything is perfect. Here’s what’s still problematic:
- Since September 2025, zeropod no longer uses
--tcp-establishedfor CRIU. This means if your container has outgoing TCP connections at checkpoint time, they will be lost. In practice, for a web server, this means reconnecting to the database after restore. With zeropod, the MySQL connection is re-established automatically (the current PHP request fails, the next one succeeds). This is a detail that may matter depending on your use case. - I only tested WordPress (Apache + mod_php) and MySQL. Applications using websockets, streaming, or long-lived connections might behave differently.
- I had difficulties getting it to work properly on k3s.
- I observed a glitch (Apache segfault) on the first restore of a freshly created WordPress pod. It’s not reproducible after a normal checkpoint/restore cycle, but if you frequently redeploy your pods, you might encounter it.
Verdict
One year later, zeropod seems to deliver on more of its promises:
- Even though it wasn’t a dealbreaker, checkpoint/restore performance has improved significantly (~50% faster), which is always welcome
- Kubernetes probe support has been added, lifting what I considered the main blocker
- General stability is better
- The cascade test (WordPress + MySQL) works
I’m still just as hyped about the idea of freezing a container and restoring it 10 seconds later like nothing happened. The magic of CRIU and eBPF combined is starting to materialize, after years of waiting.
Would I put this in production? Let’s say it’s less risky than a year ago. On my personal cluster for fun, why not. For a production database with long-lived connections, I think I’d still pass ;-).
But honestly, the project has evolved well and deserves a closer look.